For new users
Glad you're here! We'll make this quick—just a few things we want to let you know before you get too far into the Notebook.
Different Notebooks have different features
The Analyst's Notebook for each mission is different from the others. It is tailored to the mission, and information available from the archives and from science team results in a unique Notebook with specific features. You will find these help pages mostly applicable to recent Notebooks—those for MSL Curiosity, InSight, and MER Spirit and Opportunity. When you see a label like MSLApplies to the
MSL AN in the help, the text is relevant to the specific mission Notebook(s). We are working to unify the look and feel for all Notebooks and their help.
This is a good place to mention that the Mars rovers are named apart from the mission name. Curiosity is the rover of the Mars Science Laboratory (MSL) mission, and Spirit and Opportunity are from the MER (Mars Exploration Rovers) missions. Sometimes we use the mission name in the Notebook and sometimes the rover name, but we usually are referring to the same thing.
Notebook sections
The Notebook has a number of sections to help you better understand the mission and access the data. You can switch to different sections by clicking on the tabs on the left side of the Notebook (or along the top for older missions).
| Mission
High-level overview of the mission. Information is derived from the mission science and instrument teams reports. |
|
| Sol
Detailed surface operations listings on day by day basis. Includes data products, documents, targets, mosaics, and plans. |
|
| Search
Customizable searches for data, targets, and documentation. |
|
| Maps
Interactive plot showing rover traverse over time. |
|
| Resources
Additional information about the mission and data |
|
| User
Management of personalized settings, history, favorites, and your cart. |
|
| Help Information on using the data and the Notebook. |
You can read more about navigating the Notebook and about the Notebook sections.
Science data and file formats
You might see beautiful images and nice-looking graphs in the Notebook. These are representations of the data collected on Mars and the moon. What you'll get when you download the data is the science version of the data that planetary scientists use for research. These are the peer-reviewed data that comprise NASA's Planetary Data System archives, and they are in an archive format.
Some of the science data can be opened with standard software (for example, some tables are in CSV format that can be opened by Excel). Or you may need specialized software to work with some data, as is the case with most images. That brings us to the next topic...
How do I know what I want?
You probably know that you want data from a particular instrument, but you may not know how the data are organized or formatted. Here is a simple two-course introduction.
You will see the term "data products" a lot. A product refers to a chunk of data that is from a scientific observation. (It could also be just part of an observation, or contain data from multiple observations.)
Every observation produces one or more raw, uncalibrated data products—sometimes called an EDR (Experimental Data Record). When the science team further processes or calibrates the data, a partially processed, calibrated, or derived product—sometimes call an RDR (Reduced Data Record)—is born.
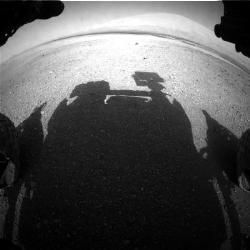
For example, let's take a raw Curiosity Hazard Avoidance Camera image. Because the camera has such a wide angle, the flat horizon looks curved. To fix this, the camera team creates a "linearized" version (a partially processed product) that makes the image look like what our eyes would see. We now have two different data products from the same observation.
The science team sometimes creates many derived products from a single raw product. Rather than call them raw and derived products, we refer to different product types of the same observation. Take a "deep dive" on understanding data products when you're ready to immerse yourself in the topic.
When you look at a data product in the Notebook, keep in mind that there probably are several types of the product available. You need to know with which product type you want to work (see the next course on product documentation).
Welcome to the data product SIS (pronounced as a word siss, not as individual letters). SIS stands for Software Interface Specification. You don't need to remember that—it won't be on the test.
The data product SIS describes the science content and format of data products. It is useful for determining which product types might be of interest to you. It describes how the data are formatted, and usually details the instrument configuration.
Each instrument team works hard to produce a data product SIS as part of the data archiving process. The SISs are peer reviewed, just like the data.
So, where to find the SIS? They are on the data set documents page. You can get there from the Resources tab. You also can get there from a data product detail page (Help) in the menu bar.
A final word: there may be a few other SISs in the data set documents. You should be looking for the data product SIS.
Do not return this item to the store
Have ever bought an item that doesn't seem to work? You are about to take it back and then notice a sticker with the words "do not return this item to the store". The manufacturer would rather have you call them to work out the problem.
We feel the same way. If something isn't working or doesn't make sense, let us know! We want everything in tip-top shape.
You can access the feedback form from the Help section, or post questions on our user forum or send us an e-mail.

